 Get Hooked!
One map. Every layer feeds the engines.
Other fishing maps are a place where features end: radar draws radar, charts draw depth, pins sit where you dropped them. Here the map is where the inputs meet — the bottom, your catches, the rivers, the sky — and all of it is read against your own log before it's drawn.
Layers that stack
Depth under fish under rate
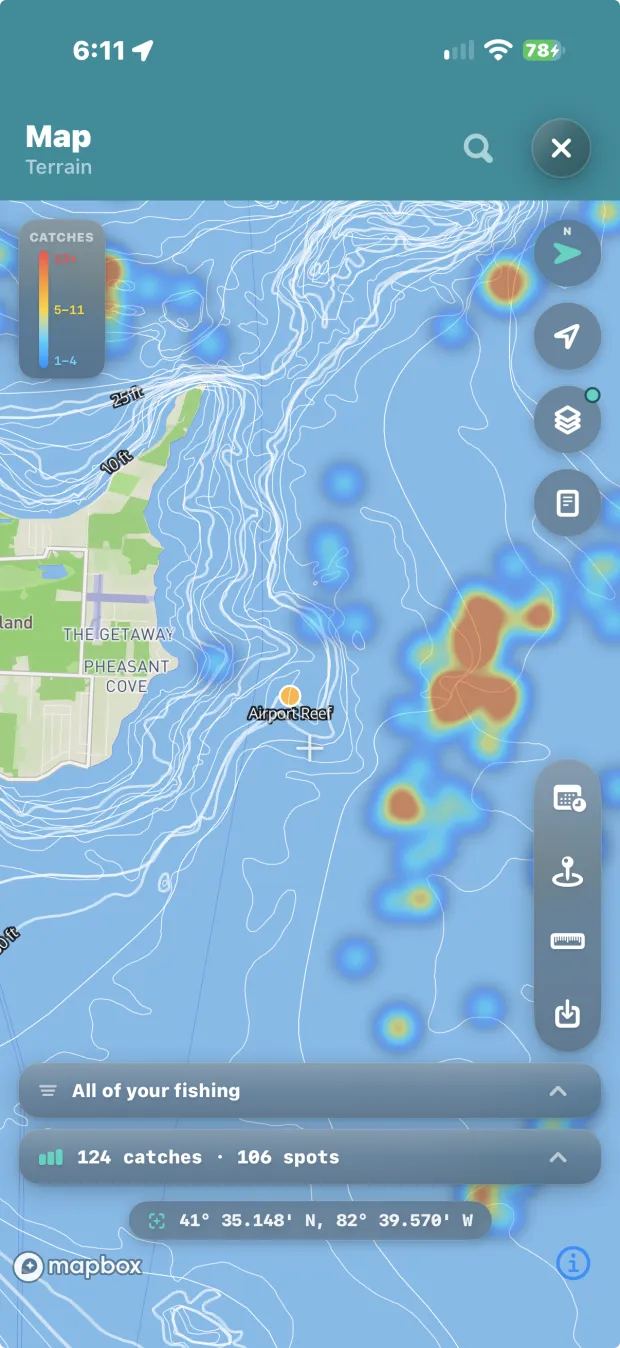
Contours, your catches and the heat map on one map at once, instead of three screens you flip between. Filter the stack by season and year and it stops being a map of pins and becomes a map of your fishing.
Your catches
Every spot and catch you've logged, where it happened. Imported plotter files draw beside them in their own colours, and a switch on a file never touches your own fish.
Catch heat map
Weighted by catches per hour, not visits — the reef you hit once and limited out on burns brighter than the home water you idle past weekly. Where there isn't enough logged effort to support that, it falls back to counts and says so.
Ranked areas
Every area you keep, scored seven days out against your own catch history — in order, on the map, with the best day for each.
Plan my trip
One tap turns the ranked week into a plan: the window worth the fuel, the leg with the most behind it, a fallback if it cools, and one run through water you've never fished — with what it left out, and why.
Rivers, from their gages
Tap a gage and the water it measures draws itself — the main stem and every feeder, sized by how much water each carries. Rivers in full →
Radar & sky
Live radar, cloud imagery and satellite views over the same map, so the sky as it is sits over the water you're about to run.
Buoys, tides & flow
Live readings for your water, kept on the phone so they answer offline.
Ramps, marinas & fuel
The places you get on and off the water — boat ramps, marinas, kayak launches and marine fuel docks. A slip-kept boat treats the marina as its ramp, which is why both are here, and why campgrounds and tackle shops are not.
Contours past a named reef with the heat map over them — 124 catches across 106 spots, one map, one glance.
The bottom
Depth data that is actually ours
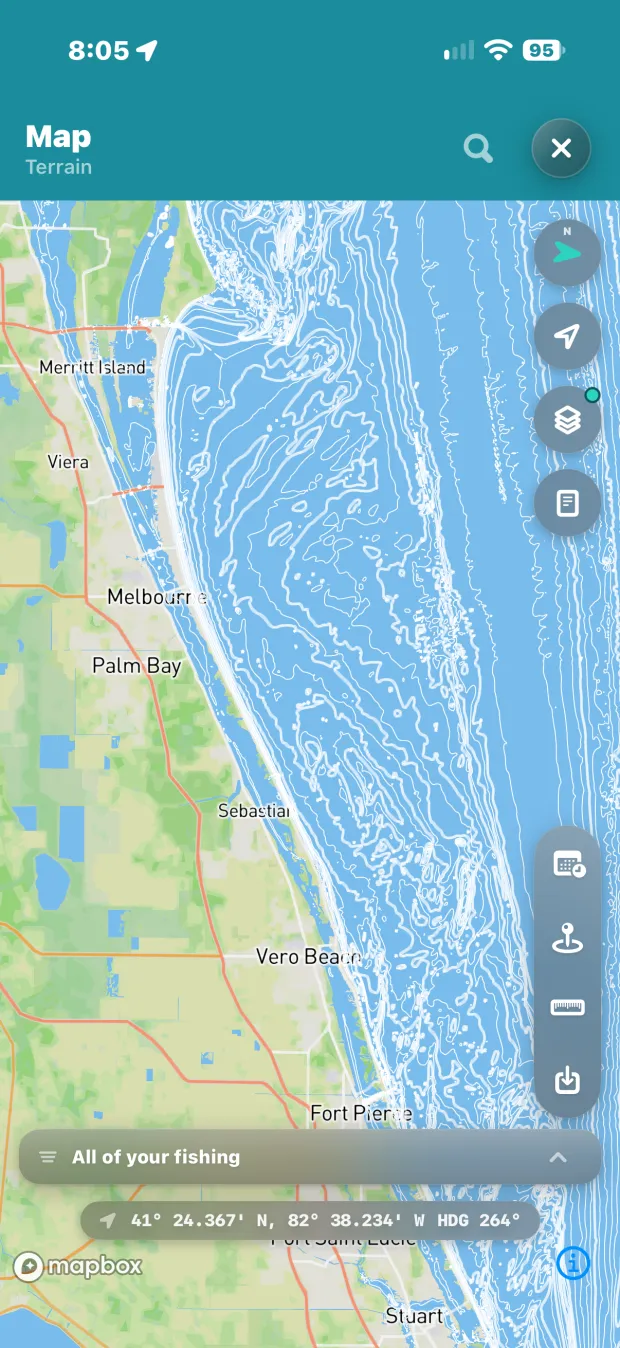
Everyone else licenses charts to draw them. This depth data is built from public sources and belongs to the app — which is what lets it feed the engines instead of sitting on the screen as somebody's layer. Twelve packs ship today, inland and coastal, and the map never claims water it doesn't have.
Contours in feet
Lake Erie, Huron, Michigan and Ontario, plus inland lakes across Ohio, Michigan, Minnesota, Indiana and Illinois — Indian, Pymatuning, Mille Lacs, Alum Creek, Salt Fork, Buckeye and more.
Coastal water
Six coastal regions from the Atlantic Northeast to the Pacific Northwest, Gulf both sides — cut from NOAA's coastal relief survey and field-tested on salt.
Structure worth running to
Named reefs and shoals with depth ranges, 506 placed fish attractors, standing timber, stumps, lily pads, drowned stream channels, and hard-versus-soft bottom.
Chart paper
One tap flips the map to a paper-chart look — black contours on white water — legible in full sun, over any basemap.
Smart pills
Filters appear only where their data exists. The map answers for the water you're actually looking at, and lists a state as unavailable rather than drawing a blank that pretends.
Bottom depth on a catch
Log the water depth alongside the lure depth, and an estimate never overwrites what you typed.
Depth data: state natural-resources agencies (Ohio DNR and counterparts) · NOAA NCEI, including the Coastal Relief Model. The whole list is on the credits page.
Your fish, moving
A season, played back
Because the layers stack and filter by season and year, the map can do something no crowd app can: draw your fish moving. April against June against October — your own log sliding from the spawning flats to the summer breaks to the fall feed. And once the log has a season in it, the map animates the whole year, so you watch where you caught fish and when.
Real playback, not a mockup: April into May on one angler's own log, 51 catches across 4 spots becoming 113 across 10 as the season turns. Nobody else can build this, because nobody else has your log.
Tools
Built for a rod in one hand
Drop pin
Mark water without logging a fish there. It stays armed and saves the moment you tap, so a pin is never lost to a second tap.
Measure
Tap out a run and the line answers what it implies — distance, bearing, time, fuel, and whether it fits your tank with a reserve left. It knows your boat because you told My Boat once.
Arrival intelligence
Pull up to a spot and the app tells you what's worked here: species, bait, depth, this summer and last.
Your files
Anything imported from a plotter or another app lives under My Data → Files. Hide a file, filter its symbols or recolour its pins and the map follows.
Buddy Share
Your live position on a buddy's map, for a day at a time. They see where you are; they never see your spots, your catches or anything you've logged.
Something hidden
Somewhere on the map lives a fish who has read your log. Finding him is the game, so how isn't written down anywhere, including here.
With no signal
The map comes with you
Offline isn't a degraded mode here; it's the working state. Tell the app where you're going and it downloads the map itself for that water — so offline isn't just your data, it's the ground under it.
Offline packs
A whole state or coastal region's bottom data, a few MB, downloaded once and working with no signal. Sizes shown before you download.
Rivers, once loaded
A river you've drawn is on the device. It draws again three hours from a tower.
Readings, offline
Buoys, tides and gages are on the phone before you need them. Anything showing its age is telling you it couldn't refresh, not guessing.